{{selectedAlertBand.alertDescription}}
{{selectedAlertBand.incident.heading}}
Message last updated - Friday 10th April 2026
{{selectedAlertBand.incident.heading}}
Message last updated - Friday 10th April 2026
Message last updated - Friday 10th April 2026
{{selectedAlertBand.alertLinkText}} {{selectedAlertBand.alertLinkText}}
For further updates subscribe
We’re the driest region in the UK, and with a fast-growing population, it's important that we monitor water resources closely to keep taps flowing and toilets flushing now and long into the future. That's why we're always exploring different ways to save and protect every drop.
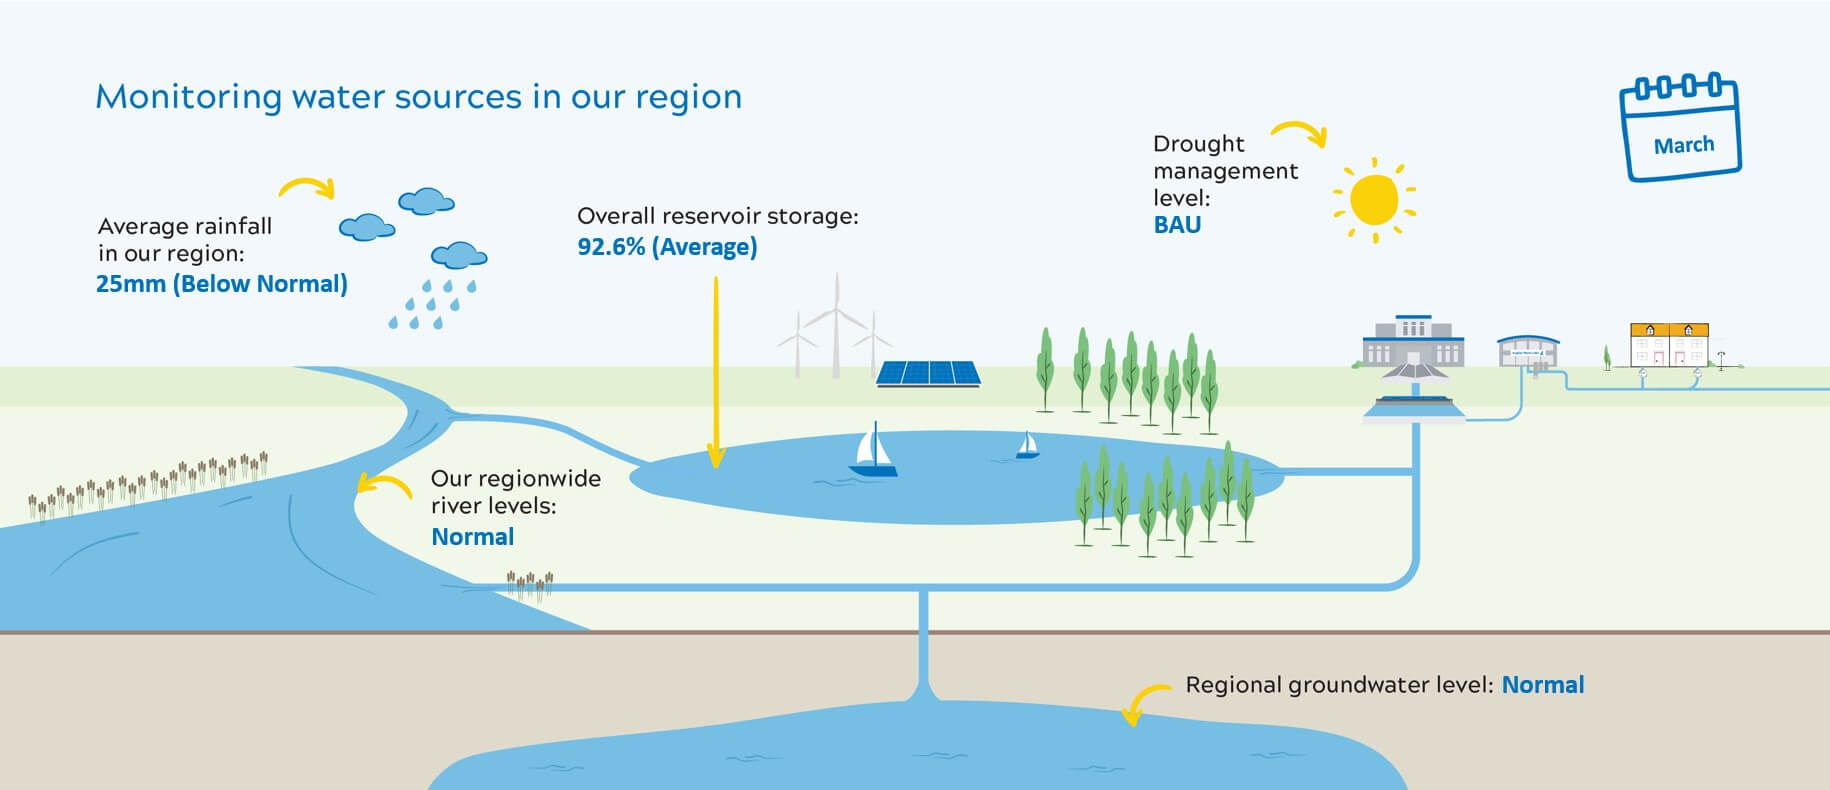
In 2025 our region experienced the driest spring and summer since 1976, and the summer was the warmest on record for the UK. This meant the majority of our water resources were at low levels heading into the 2025/26 winter. Fortunately, due to several wet months and careful management there has been strong recharge, and most sources are now back to normal levels. However, groundwater sources in some parts of the region such as Norfolk are still recovering so we are keeping an enhanced focus in this area. We're continuing to work round the clock to fix our pipes, upgrade our systems and secure more water for the future. By using a little less to save every drop you can help too. Small changes make a big difference.
The graphic below shows the current water resource levels across the region. Please note that we only receive all the data required to update this graphic in the middle of each month for the previous month.
Water Sources
Around half the water we supply comes from groundwater sources (e.g. boreholes) and the other half comes from surface water sources (e.g. reservoirs and rivers).
Groundwater
Groundwater moves below our feet in rocks, with levels typically rising when temperatures and evaporation is low and soils are wet. The time taken for groundwater levels to respond to rainfall can range from hours to a few months, depending on the type of soil, rock and depth to groundwater. This water can be used by drilling holes (boreholes).
Rivers
As well as abstracting water from rivers for storage in our reservoirs we can also abstract water from rivers to get directly pumped to our treating and cleaning works (we call these direct river intakes). We help manage our water supply by taking care and protecting over 3,000 km of rivers.
Reservoirs
We abstract water from rivers to fill our 6 key reservoirs around the region.
Scroll through the table below to view our weekly reservoir levels and whether they are above, below or at average levels for the time of year. The table is updated with data from the start of each week:
| Reservoir (06/04/26) | Level % | Status |
| Alton | 97.60 | Above Average |
| Ardleigh | 87.18 | Below Average |
| Covenham | 95.50 | Average |
| Grafham | 85.14 | Below Average |
| Pitsford | 100.00 | Average |
| Rutland | 95.38 | Average |
Your local sources
We’re the largest water company by geographic area, and because the environments we cover are so different, some areas in our region may experience more challenges than others and react differently to weather conditions. For more information about your local water sources, find out where your water comes from.